29 Jul Air Quality Check Using Asynchronous Web Server with MQ135 Gas Sensor and Esp8266NodeMCU
In this blog, We can learn about Air Quality Check Using Asynchronous Web Server with MQ135 Gas Sensor and Esp8266NodeMCU
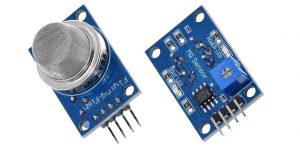
Air Quality Check Using Asynchronous Web Server with MQ135 Gas Sensor and Esp8266NodeMCU. The MQ135 gas sensor, which is a type of air quality sensor detects different varieties of gases such as NH3, alcohol, NOx, benzene, CO2, and smoke. This gas sensor is highly sensitive to gases like Ammonia, Benzene steam, sulfide, smoke, and many other poisonous gases.
MQ135 Gas Sensor Specification
- Power: 2.5V ~ 5.0V
- Dimension: 40.0mm * 21.0mm
- Mounting holes size: 2.0mm
BOM
- Esp8266NodeMCU
- MQ135 Gas Sensor
- Jumper Wires
- Breadboard (optional)
MQ135 Gas Sensor
Circuit Diagram
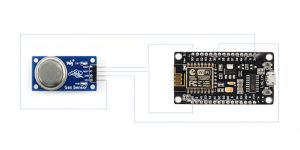
| NodeMCU | MQ135 |
| D0 | DOUT |
| A0 | AOUT |
| GND | GND |
| VCC | VCC |
Libraries Installation
Installation of ESPAsyncTCP and ESPAsyncWebServer libraries are necessary to create Asynchronous Web Server. But these libraries are unavailable in the Arduino Library Manager. However, you can download them from the links given below and add it from sketch/include Library/Add .Zip folder to your Arduino ide.
1) ESPAsyncWebServer
https://github.com/me-no-dev/ESPAsyncWebServer/archive/master.zip
2) ESPAsyncTCP
https://github.com/me-no-dev/AsyncTCP/archive/master.zip
Code
From this program let’s understand how to read the data of Analog Gas Sensor from the MQ135 Gas Sensor, visualizing the real-time data on a chart and representing the air quality using a variety of colors on Asynchronous Web Server.
| #include <Arduino.h> | |
| #include <ESP8266WiFi.h> | |
| #include <Hash.h> | |
| #include <ESPAsyncTCP.h> | |
| #include <ESPAsyncWebServer.h> | |
| #include <Adafruit_Sensor.h> | |
| //———————–Network Credentials——————————– | |
| const char* ssid = “YOUR_WIFI_SSID”; | |
| const char* password = “YOUR_PASSWORD”; | |
| //—————————Create AsyncWebServer object on port 80———————————– | |
| AsyncWebServer server(80); | |
| float t = 0.0; //Initialising the variable t which will be used to store the Analog Sensor value later on. | |
| //————————————————-HTML CODE——————————————————————- | |
| const char index_html[] PROGMEM = R”rawliteral( | |
| <!DOCTYPE HTML><html> | |
| <head> | |
| <meta name=”viewport” content=”width=device-width, initial-scale=1″> | |
| <script src=”https://code.highcharts.com/highcharts.js”></script> | |
| <style> | |
| body { | |
| min-width: 310px; | |
| max-width: 800px; | |
| height: 400px; | |
| margin: 0 auto; | |
| min-height:100%; | |
| } | |
| h2 { | |
| font-family: Arial; | |
| font-size: 4.0rem; | |
| text-align: center; | |
| } | |
| #sensor{ | |
| text-align: center; | |
| font-size: 20px; | |
| font-size: 25px; | |
| } | |
| .button { | |
| background-color: LimeGreen; /* Green */ | |
| border-radius:10px; | |
| border:none; | |
| color: #213346; | |
| padding: 15px 32px; | |
| text-align: center; | |
| text-decoration: none; | |
| display: inline-block; | |
| font-size: 26px; | |
| margin: 4px 2px; | |
| cursor: pointer; | |
| width:100%; | |
| } | |
| table, th, td { | |
| text-align: center; | |
| width: 30%; | |
| } | |
| </style> | |
| </head> | |
| <body> | |
| <h2 style=”color:#213346;”>A<span style=”color:#E84638;font-weight:bold”>V</span>OTRIX</h2> | |
| <!– ———————————–Table Showing the air quality Range ————————————-> | |
| <div class=”rangetable”> | |
| <table > | |
| <tr> | |
| <th style=”width:10%;”>Color</th> | |
| <th>Air Quality</th> | |
| <th>Range</th> | |
| </tr> | |
| <tr> | |
| <td style=”background-color:limegreen; width:10%;”></td> | |
| <td>Fresh Air</td> | |
| <td>0-300</td> | |
| </tr> | |
| <tr> | |
| <td style=”background-color:gold; width:10%;”></td> | |
| <td>Moderate Air</td> | |
| <td>301-700</td> | |
| </tr> | |
| <tr> | |
| <td style=”background-color:red; width:10%;”></td> | |
| <td>Polluted Air</td> | |
| <td>701-1024</td> | |
| </tr> | |
| </table> | |
| </div> | |
| <br> | |
| <!– ———————————–Color Bar showing Air Quality————————————-> | |
| <div id=”Buttoncontainer”> | |
| <input type=”button” value=”Fresh Air” id=”ColorButton” class=”button”> | |
| </div> | |
| <!– ———————————–Displaying the Sensor Value ————————————-> | |
| <div id=”sensor”> | |
| <div id=”chart-GasSensor” class=”container”></div> | |
| <span class=”sensor_label”>Sensor Value :</span> | |
| <span id=”SensorValue”>%Gasvalue%</span> </div> | |
| <br> | |
| </body> | |
| </html> | |
| <!– ———————————–Script ————————————-> | |
| <script> | |
| var chartT = new Highcharts.Chart({ | |
| chart:{ renderTo : ‘chart-GasSensor’ }, | |
| title: { text: ‘Gas Sensor Data’ }, | |
| series: [{ | |
| showInLegend: false, | |
| data: [] | |
| }], | |
| plotOptions: { | |
| line: { animation: false, | |
| dataLabels: { enabled: true } | |
| }, | |
| series: { color: ‘#059e8a’ } | |
| }, | |
| xAxis: { type: ‘datetime’, | |
| dateTimeLabelFormats: { second: ‘%H:%M:%S’ } | |
| }, | |
| yAxis: { | |
| title: { text: ‘Gas Analog Vaue’ } }, | |
| credits: { enabled: false } | |
| }); | |
| setInterval(function ( ) { | |
| var xhttp = new XMLHttpRequest(); | |
| xhttp.onreadystatechange = function() { | |
| if (this.readyState == 4 && this.status == 200) { | |
| var x = (new Date()).getTime(), //X axis for time representation | |
| y = parseFloat(this.responseText); //Y axix for Analog Gas value Representation | |
| document.getElementById(“SensorValue”).innerHTML = this.responseText; | |
| z= parseFloat(this.responseText); | |
| //——–Fresh air COndition—————————————————- | |
| if(z<500){ | |
| document.getElementById(“ColorButton”).style.backgroundColor=”limeGreen”; | |
| document.getElementById(“ColorButton”).value=”Fresh Air”; | |
| } | |
| //——–Moderate air COndition—————————————————- | |
| else if(z>500 && z<1000){ | |
| document.getElementById(“ColorButton”).style.backgroundColor=”Gold”; | |
| document.getElementById(“ColorButton”).value=”Moderate Air”; | |
| } | |
| //——–Polluted air COndition—————————————————- | |
| else if(z>1000){ | |
| document.getElementById(“ColorButton”).style.backgroundColor=”red”; | |
| document.getElementById(“ColorButton”).value=”Polluted Air”; | |
| } | |
| //console.log(this.responseText); | |
| if(chartT.series[0].data.length > 40) { | |
| chartT.series[0].addPoint([x, y], true, true, true); | |
| } else { | |
| chartT.series[0].addPoint([x, y], true, false, true); }} }; | |
| xhttp.open(“GET”, “/sensorvalue”, true); | |
| xhttp.send(); | |
| }, 2000 ) ; | |
| </script> | |
| </html>)rawliteral”; | |
| //————————————————-End of HTML Code————————————————- | |
| //——————————–Function to read analog Value from Gas Sensor———————————– | |
| String ReadGasSensor(){ | |
| float t=analogRead(A0); | |
| if(isnan(t)){ | |
| Serial.println(“Failed to read from the sensor!”); | |
| return “”; | |
| } | |
| else { | |
| Serial.println(t); | |
| return String(t); | |
| } | |
| } | |
| //————————————————————Setup———————————————————- | |
| void setup(){ | |
| // Serial port for debugging purposes | |
| Serial.begin(115200); | |
| //——————————–Connecting to Wifi————————————– | |
| WiFi.begin(ssid, password); | |
| Serial.println(“Connecting to WiFi”); | |
| while (WiFi.status() != WL_CONNECTED) { | |
| delay(1000); | |
| Serial.println(“.”); | |
| } | |
| //Print ESP8266 Local IP Address | |
| Serial.println(WiFi.localIP()); | |
| //————————-Http Requests——————————————————– | |
| // Route for root / web page | |
| server.on(“/”, HTTP_GET, [](AsyncWebServerRequest *request){ | |
| request->send_P(200, “text/html”, index_html); | |
| }); | |
| server.on(“/sensorvalue”, HTTP_GET, [](AsyncWebServerRequest *request){ | |
| request->send_P(200, “text/plain”, ReadGasSensor().c_str()); | |
| }); | |
| //————————Start the Server———————————————————————– | |
| // Start server | |
| server.begin(); | |
| } | |
| //————————————————-End Of the Setup———————————– | |
| void loop(){ | |
| //Nothing happens here | |
| } |
view rawairqualitycheck.ino hosted with ❤ by GitHub
How does the code work?
This code intends to display the quality of air on the Asynchronous Web Server using the MQ135 sensor.
Html Code
Now, let’s design our Web page and find out the ways to send requests from the Html Web page to ESP8266.
HTML
1) First step is to add the highcharts library
| <script src=”https://code.highcharts.com/highcharts.js”></script> | |
| <div class=”rangetable”> | |
| <table > | |
| <tr> | |
| <th style=”width:10%;”>Color</th> | |
| <th>Air Quality</th> | |
| <th>Range</th> | |
| </tr> | |
| <tr> | |
| <td style=”background-color:limegreen; width:10%;”></td> | |
| <td>Fresh Air</td> | |
| <td>0-300</td> | |
| </tr> | |
| <tr> | |
| <td style=”background-color:gold; width:10%;”></td> | |
| <td>Moderate Air</td> | |
| <td>301-700</td> | |
| </tr> | |
| <tr> <td style=”background-color:red; width:10%;”></td> | |
| <td>Polluted Air</td> | |
| <td>701-1024</td> | |
| </tr> | |
| </table> | |
| </div> |
view rawairqualitycheck1.ino hosted with ❤ by GitHub
2) Create a ‘span’ for Sensor Data and a ‘div’ for containing graph div.
| <div id=”sensor”> | |
| <div id=”chart-GasSensor” class=”container”></div> | |
| <span class=”sensor_label”>sensorvalue :</span> | |
| <span id=”SensorValue”>%Gasvalue%</span> | |
| </div> |
view rawairqualitycheck2.ino hosted with ❤ by GitHub
3) We use the Javascript code to create the charts and add data to it. The data should be inside the tags.
The below-mentioned spinet creates a Gas chart, which is followed by defining the chart id, the axis labels, set the title, etc.
| var chartT = new Highcharts.Chart({ | |
| chart:{ renderTo : ‘chart-GasSensor’ }, | |
| title: { text: ‘Gas Sensor Data’ }, | |
| series: [{ | |
| showInLegend: false, | |
| data: [] }], | |
| plotOptions: { | |
| line: { animation: false, | |
| dataLabels: { enabled: true }, | |
| series: { color: ‘#059e8a’ }, | |
| xAxis: { type: ‘datetime’, dateTimeLabelFormats: { second: ‘%H:%M:%S’ } }, | |
| yAxis: { title: { text: ‘Gas Analog Vaue’ } } | |
| credits: { enabled: false } }); |
view rawairqualitycheck3.ino hosted with ❤ by GitHub
4) The setInvertal() function is used to add points to the charts. Once in every 2 seconds, it generates a request to the /sensorvalue URL to obtain ESP8266 temperature readings.
5) This setInterval() function snippet declares the variable x and y. With the getTime() function we can obtain the current time while the value ‘y’ takes the data as Sensor Value, which was obtained from HTTP.
| var xhttp = new XMLHttpRequest(); | |
| xhttp.onreadystatechange = function() { | |
| if (this.readyState == 4 && this.status == 200) { | |
| var x = (new Date()).getTime(), //X axis for time representation | |
| y = parseFloat(this.responseText); //Y axix for Analog Gas value Representation | |
| document.getElementById(“SensorValue”).innerHTML = this.responseText; |
view rawairqualitycheck5.ino hosted with ❤ by GitHub
6) To decide the bar color based on the environment quality, we take another variable ‘z’ that also takes sensor value.
| z= parseFloat(this.responseText); | |
| //——–Fresh air COndition—————————————————- | |
| if(z<500){ | |
| document.getElementById(“ColorButton”).style.backgroundColor=”limeGreen”; | |
| document.getElementById(“ColorButton”).value=”Fresh Air” } | |
| //—–Moderate air COndition—————————————————- | |
| else if(z>500 && z<1000){ | |
| document.getElementById(“ColorButton”).style.backgroundColor=”Gold”; | |
| document.getElementById(“ColorButton”).value=”Moderate Air”; | |
| } | |
| //——–Polluted air Condition—————————————————- | |
| else if(z>1000){ | |
| document.getElementById(“ColorButton”).style.backgroundColor=”red”; | |
| document.getElementById(“ColorButton”).value=”Polluted Air”; } |
view rawairqualitycheck6.ino hosted with ❤ by GitHub
7) To get the temperature readings from ESP8266, a request is made once in every 2 seconds in the snippet to the /sensorvalue URL.
| //console.log(this.responseText); | |
| if(chartT.series[0].data.length > 40) { | |
| chartT.series[0].addPoint([x, y], true, true, true); | |
| } else { | |
| chartT.series[0].addPoint([x, y], true, false, true) } } }; | |
| xhttp.open(“GET”, “/sensorvalue”, true); | |
| xhttp.send(); }, 2000 ) ; | |
| </script> | |
| </html>)rawliteral”; |
view rawairqualitycheck7.ino hosted with ❤ by GitHub
Arduino Sketch
In the Arduino sketch, we need to effectively manage the changes that take place when we get those requests. The corresponding sensor readings should be given.
1) Add all the required libraries to create an Asynchronous Webserver and activate Esp8266 Wi-Fi.
- #include <Arduino.h>
- #include <ESP8266WiFi.h>
- #include <Hash.h>
- #include <ESPAsyncTCP.h>
- #include <ESPAsyncWebServer.h>
- #include <Adafruit_Sensor.h>
2) Connect to Wi-Fi using the Network Credential.
- const char* ssid = “YOUR_WIFI_SSID”;
const char* password = “YOUR_PASSWORD”;
3) On port 80, create the Asynchronous Web Server object.
- AsyncWebServer server(80);
4) Use the required function to read the analog value from the Gas Sensor.
- String ReadGasSensor(){
float t=analogRead(A0); // Reading the Value from Analog pin A0
if(isnan(t)){
Serial.println(“Failed to read from the sensor!”);
return “” }
else {
Serial.println(t);
return String(t); } } }
5) Initiate the Serial Monitor.
- void setup(){
// Serial port for debugging purposes
Serial.begin(115200);
6) Connect to Wi-Fi.
- WiFi.begin(ssid, password);
Serial.println(“Connecting to WiFi”);
while (WiFi.status() != WL_CONNECTED) {
delay(1000);
Serial.println(“.”);
}
//Print ESP8266 Local IP Address
Serial.println(WiFi.localIP());
7) Send the Corresponding Data from the Asynchronous Web Server to Http Requests.
- // Route for root / web page
server.on(“/”, HTTP_GET, [](AsyncWebServerRequest *request){
request->send_P(200, “text/html”, index_html);
});
server.on(“/sensorvalue”, HTTP_GET, [](AsyncWebServerRequest *request){
request->send_P(200, “text/plain”, ReadGasSensor().c_str()); });
8) Start the Server.
- // Start server
server.begin();
Output:
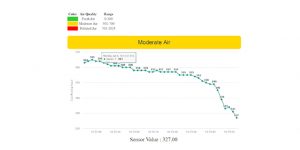
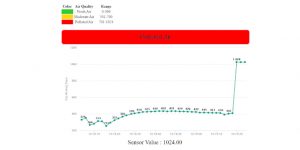
We discussed about Air Quality Check Using Asynchronous Web Server
If you still have doubts related to Air Quality Check Using Asynchronous Web Server with MQ135 Gas Sensor and Esp8266NodeMCU, feel free to post your queries on the Comment Box below and for more such technical info, don’t forget to follow us on 👍 Social Networks😉